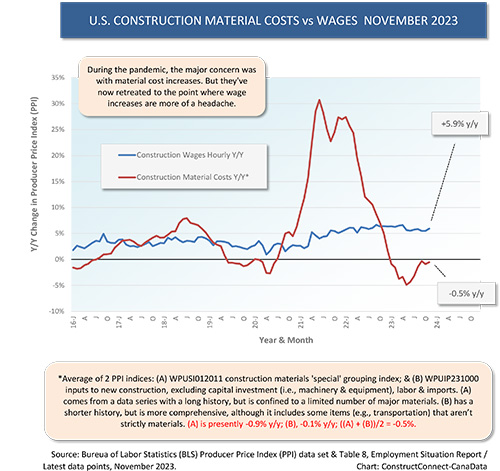
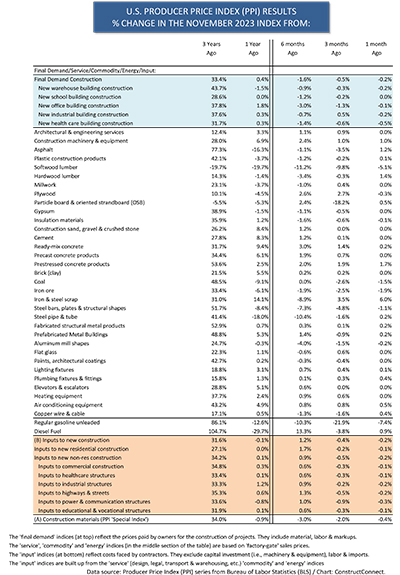
n 2021 and the first half of 2022, there were what might be termed ‘freakish’ year-over-year increases in construction material costs (see Graph 1). At its most extreme, the y/y price climb for construction material inputs collectively approached plus one third.
Since then, they have largely settled down, to the point where y/y material input costs are now being exceeded by y/y wage hikes (i.e., -0.5% compared with +5.9% as set out in Graph 1).
 Graph 2 shows that it took a while for contractors to ratchet up bid prices to cover their material cost increases. There’s a bottom line, however, and it’s that construction material input costs and bid prices are both now up close to +40% compared with their pre-COVID positions.
While this is by no means the only reason, it is one factor explaining why there are so many more mega projects (i.e., groundbreakings carrying values of a billion dollars or more each) than there used to be. The estimated expense of undertaking work has skyrocketed.
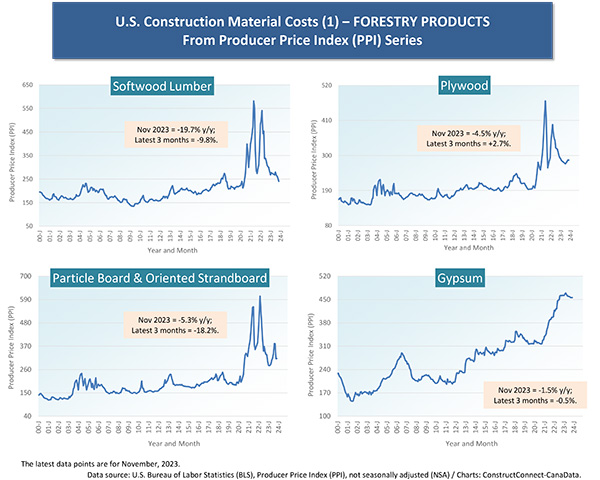
At the forefront of the 2021 kick-off in construction material costs were forestry products, especially softwood lumber, which more than doubled. Currently, though, with interest rates much higher and housing starts in North America more restrained, softwood lumber prices, according to the latest Producer Price Index (PPI) data from the Census Bureau, are -19.7% y/y, and the same down-by-a-fifth versus three years ago.
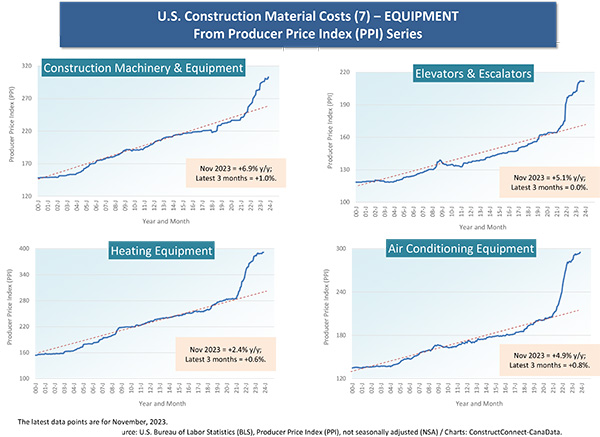
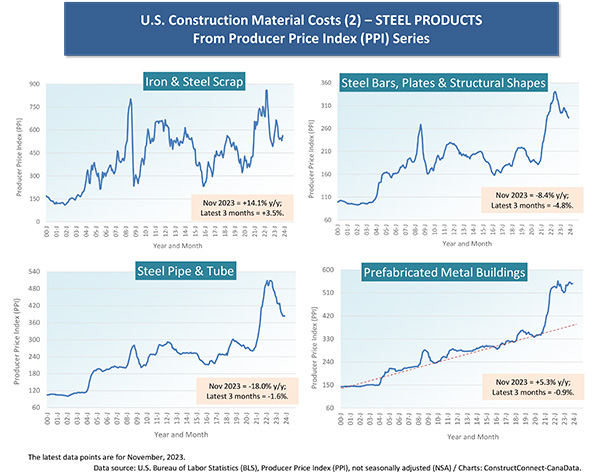
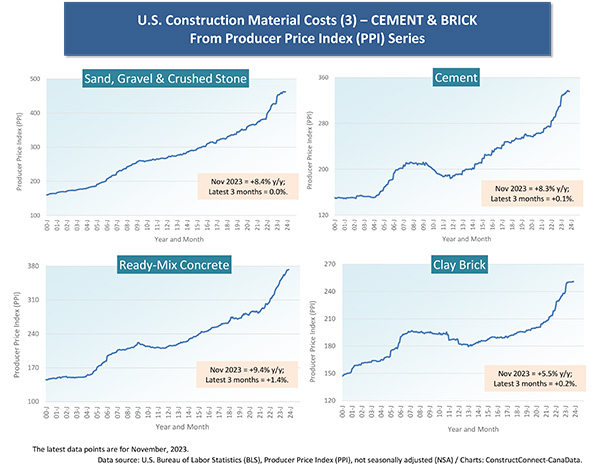
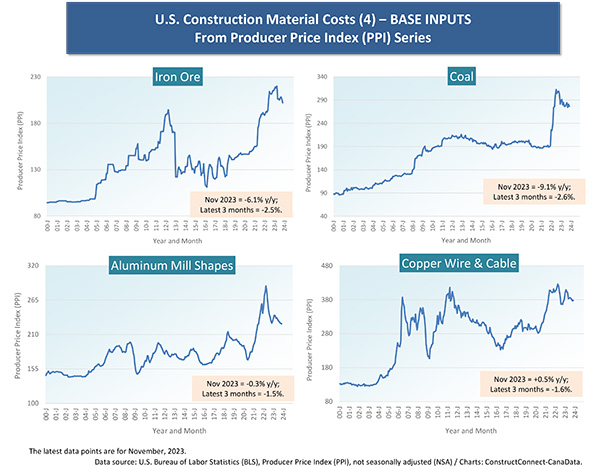
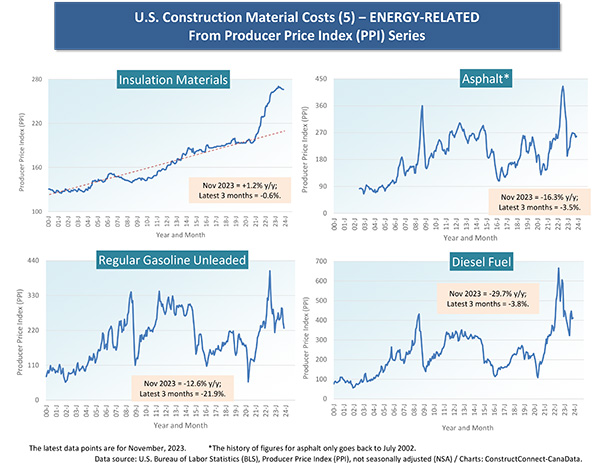
The changes in material prices for an array of inputs are most clearly shown in the accompanying Cluster Charts 1 through 7. The easing-off is readily apparent in forestry products, most steel items, and in energy-related areas.
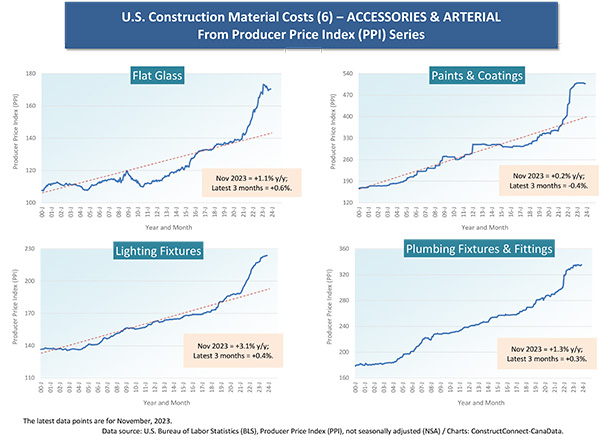
At present, with little in the way of moderation, or only a flattening, are gypsum, cement and related products, insulation materials, what are termed ‘accessory’ materials (e.g., glass, paint, lighting and plumbing fixtures), and equipment.
There’s a crucial aspect to be observed in many of the graphs, and that is the manner in which the curve has shifted from one relatively steady historical pattern to another along a considerably elevated pathway.
The red dashed lines in the graphs help to highlight this phenomenon for: prefabricated metal buildings; insulation materials; flat glass; paints and coatings; lighting fixtures; construction machinery and equipment; elevators and escalators; heating equipment; and air conditioning equipment.
Graph 1
Graph 2
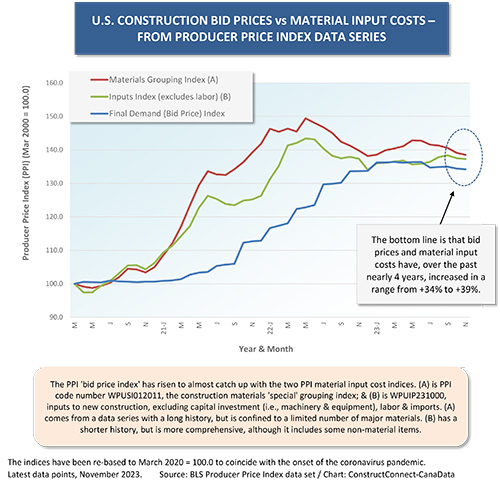
Table 1
Cluster Chart 1
Cluster Chart 2
Cluster Chart 3
Cluster Chart 4
Cluster Chart 5
Cluster Chart 6
Cluster Chart 7