Author: Luis Sampaio
The AGU journal Earth’s Future conducted a study to get an idea of what water scarcity might look like in the coming years. The study examined current and future water requirements for global agriculture and predicted whether the water levels available, either from rainwater or irrigation, would be sufficient to meet those needs under conditions caused by climate change. It was determined that if greenhouse gas (GHG) emissions continue to rise, agricultural water scarcity is predicted to intensify in 84% of the world’s croplands by 2050.
In the last 100 years, the demand for water worldwide has grown twice as fast as the human population, and water scarcity is already a major issue on every continent with agriculture. Some factors contributing to the crisis include climate change, natural disasters, war and geopolitical conflict, water waste, and lack of reliable and accurate water data.
This is a critical topic for the Pulp and Paper industry to monitor considering it is one of the largest consumers of industrial process water in the US and the second largest in Europe, as water is used within 85% of all three stages of paper production (pulp making, pulp procession and paper/paper board manufacturing). Since such a significant amount of water is used in the manufacturing procession, large volumes of contaminated wastewater are also produced.
In fact, there have already been some mill closures this year due to the water scarcity issue as rivers from which mills draw water for production from are dropping below minimum levels due to ongoing dry weather in various regions. It’s also important to note that the lack of water is not only causing disruptions due to constrained supply, but also because diminished river flows, in some cases, cannot withstand the intake of effluents, altering the concentrations to values that do not meet regulatory standards.
When looking at some of the primary P&P manufacturing destinations across the globe, ThinkHazard classifies hazard levels in regard to water scarcity (on scale of high, medium, low, or very low) of these countries as:
China: High. Based on the information available, this means that droughts are expected to occur on average every five years.
United States: High. Based on the information available, this means that droughts are expected to occur on average every five years.
Brazil: Medium. Based on this information, the impact of drought must be considered in all phases of projects.
Japan: Medium. Based on the information, this means there is up to 20% chance droughts will occur in the coming 10 years.
Germany: Medium. Based on the information, this means there is up to 20% chance droughts will occur in the coming 10 years.
According to Tom Hayden, Global Marketing Director, Industrial Water Treatment for Pulp and Paper, Solenis LLC, in an interview with Tappi, “To help address and alleviate this global water crisis, we need to reduce our demand by using our limited freshwater resources more efficiently, avoid exceeding the water replenishment threshold, and return balance to the regions that have already exceeded this threshold. For our water resources to be sustainable long-term, we must reduce usage to conserve fresh water, and we must continue to find new ways to reclaim process water and wastewater.”
Fisher echoes this belief, which is why we offer participants in the paper industry the ability to access accurate data and benchmarking regarding the water stewardship and environmental performance of their company or of their suppliers.
Fisher’s Water Intensity Index allows users to benchmark the water conservation performance of mills (measured in volume of water per ton of production), providing values that can be compared for mills, companies or regions and can be analyzed in the context of water risk for any given area(s). This data can now be used by consumers of pulp and paper products to benchmark their suppliers, which as mentioned earlier, is a factor more consumers are taking into consideration during the purchasing process.
To get a better understanding of how this works, let’s look at a hypothetical use-case using kraft pulp mills as an example. Pulp is a product that is made in different regions and traded globally, and it is used for a variety of paper grades from tissue to packaging. Because of this diversity and its global nature, pulp is a compelling grade for benchmarking.
Water Risk is assessed by the World Resources Institute per the Aqueduct™ that evaluates each area’s total water risk based on scarcity, regulatory and quality measures. A high water risk score indicates that the area in which a mill is situated in is at risk for water-related concerns — including quality, scarcity or regulatory issues. In other words, a mill in the Middle East that is using a lot of water might be higher risk than a similar mill on a large river in Russia.
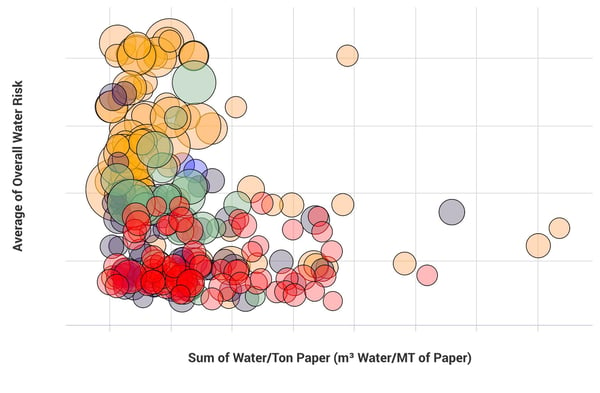
In the chart below, we can visualize three pieces of information about global kraft pulp mills: the average water intensity (x axis), the water risk in the area the mill is located (y axis), and the total volume of water consumed at the mill (bubble size). The color of the bubble indicates the region in which the mill is located.

FisherSolve users can then drill down into the details to benchmark individual mills and companies, which is useful for both buyers of pulp and competitors alike. Access to this kind of environmental data is important as the global consumer understanding of these issues expands and corporate stewardship of water resources becomes increasingly important (much in the way “carbon footprint” has become a standard metric), and likely, a part of one’s license to operate in a world increasingly aware of Environmental, Social & Governance (ESG) issues.